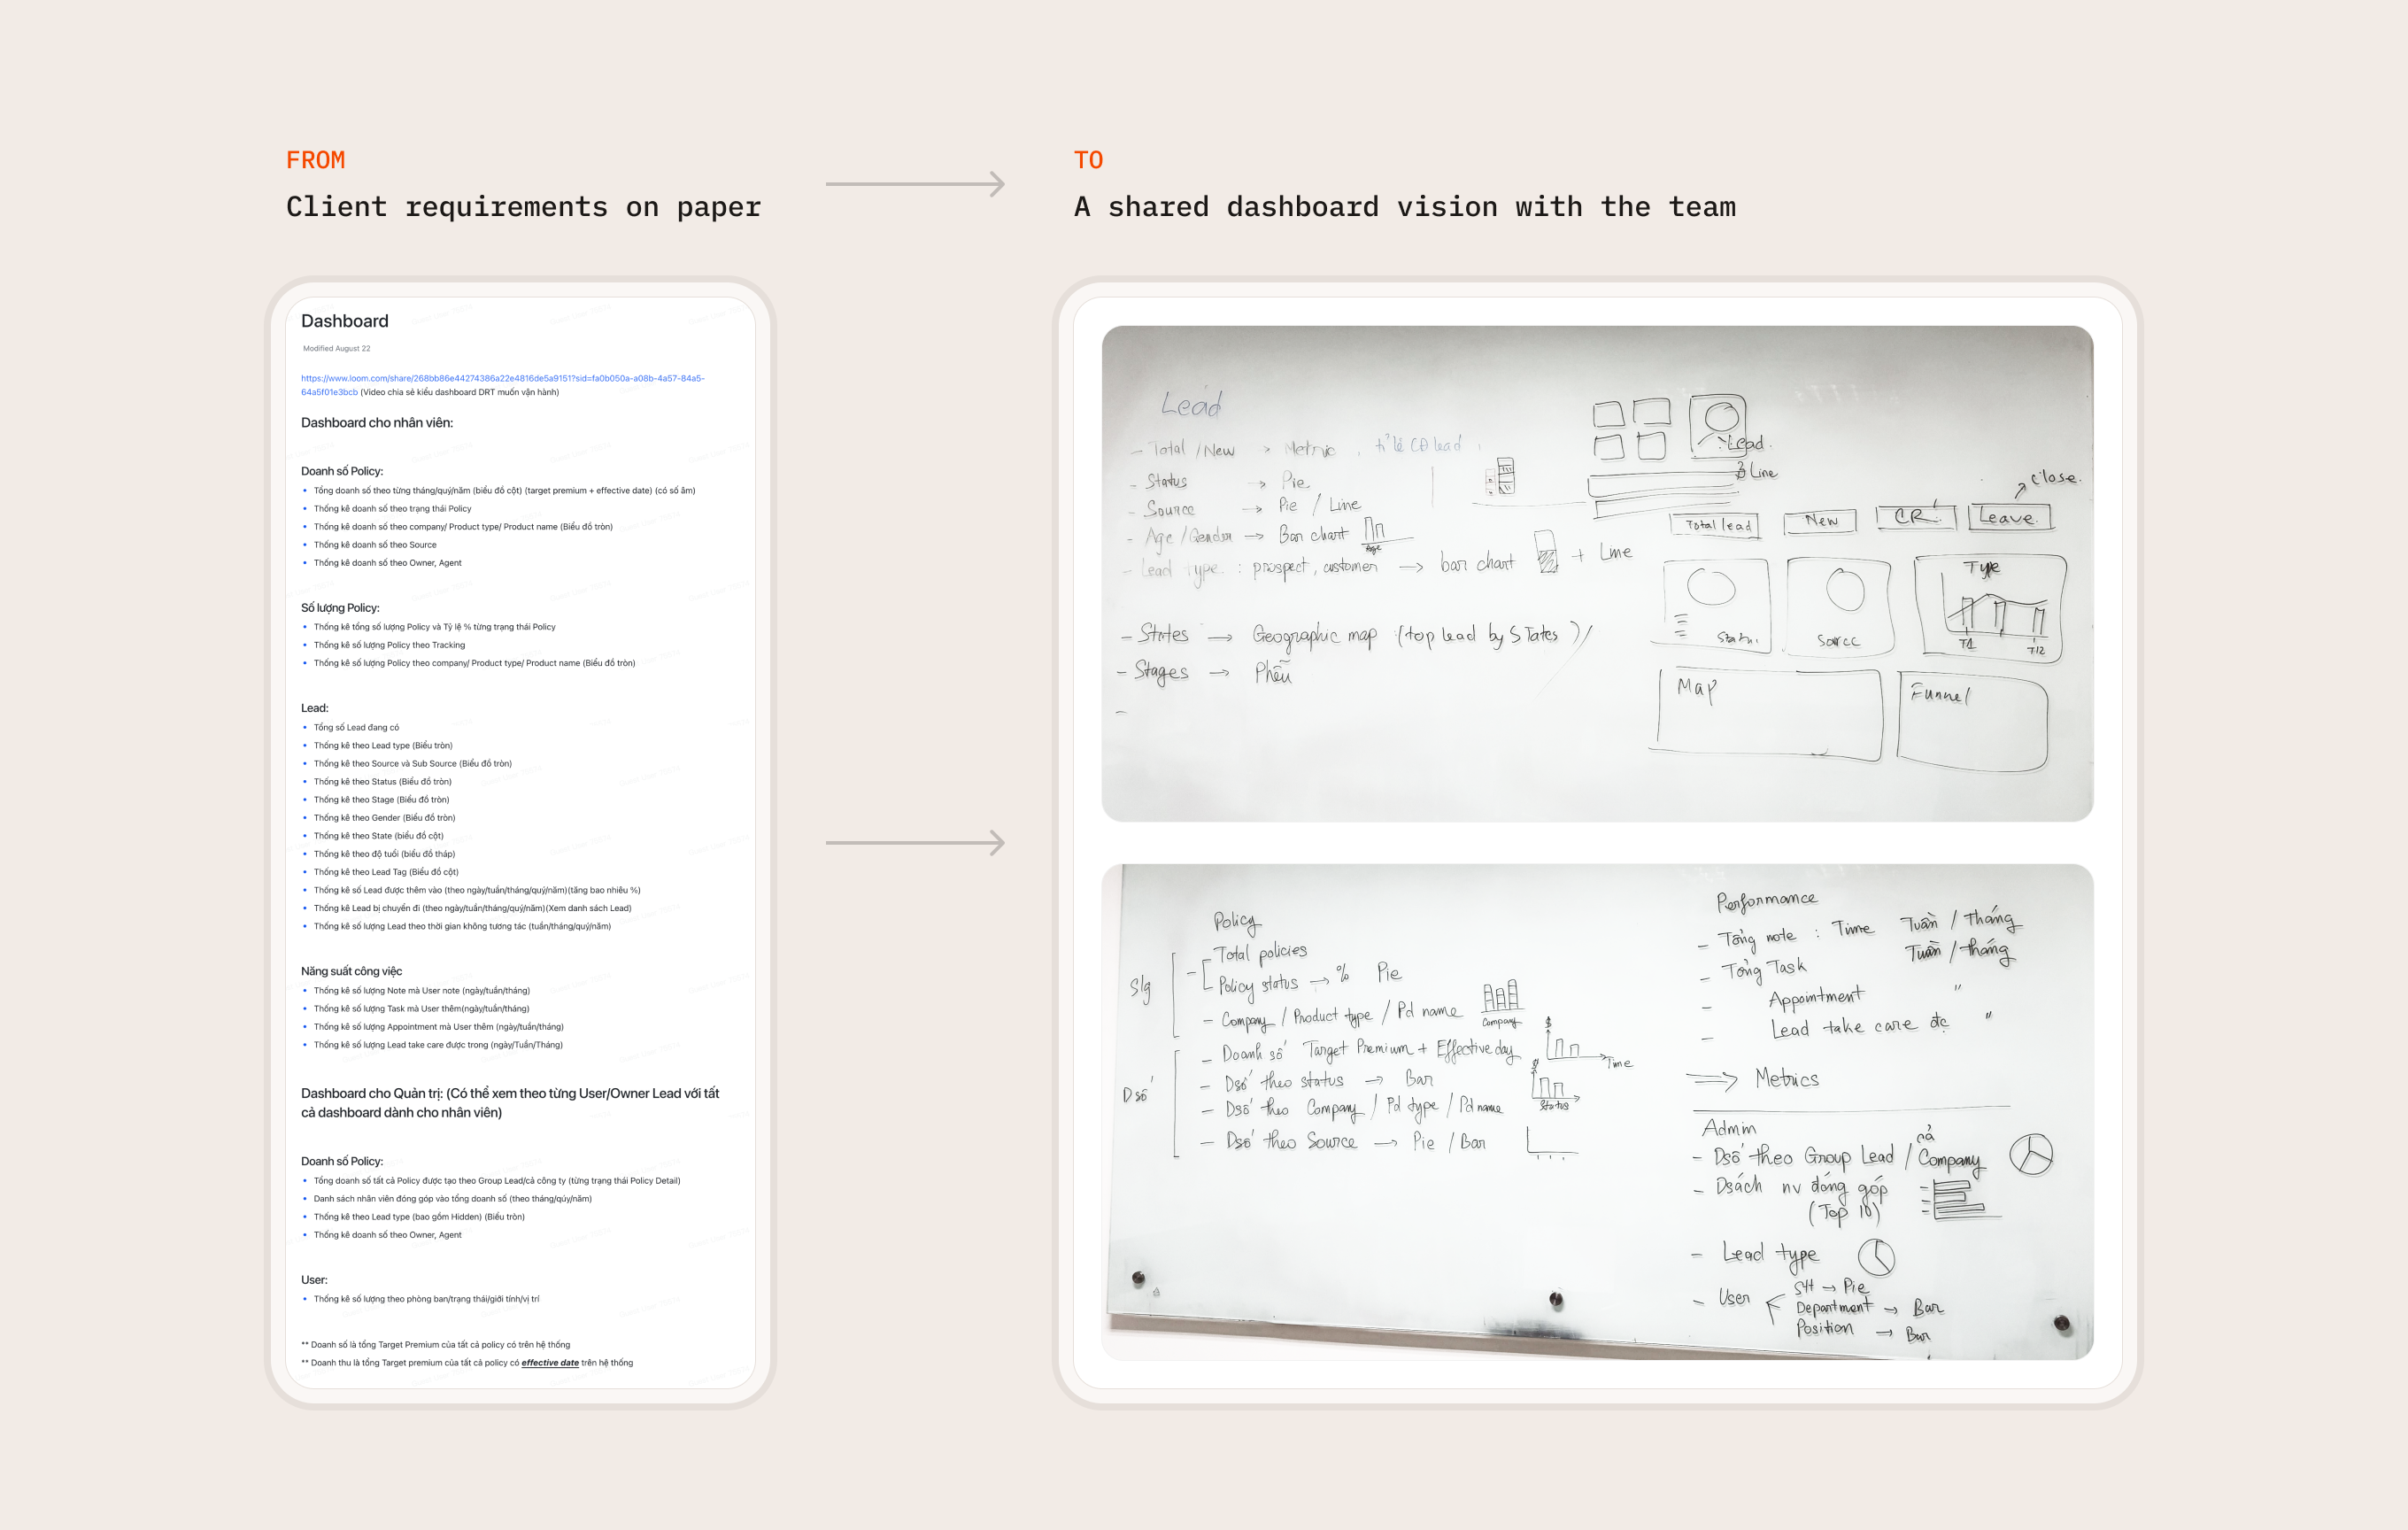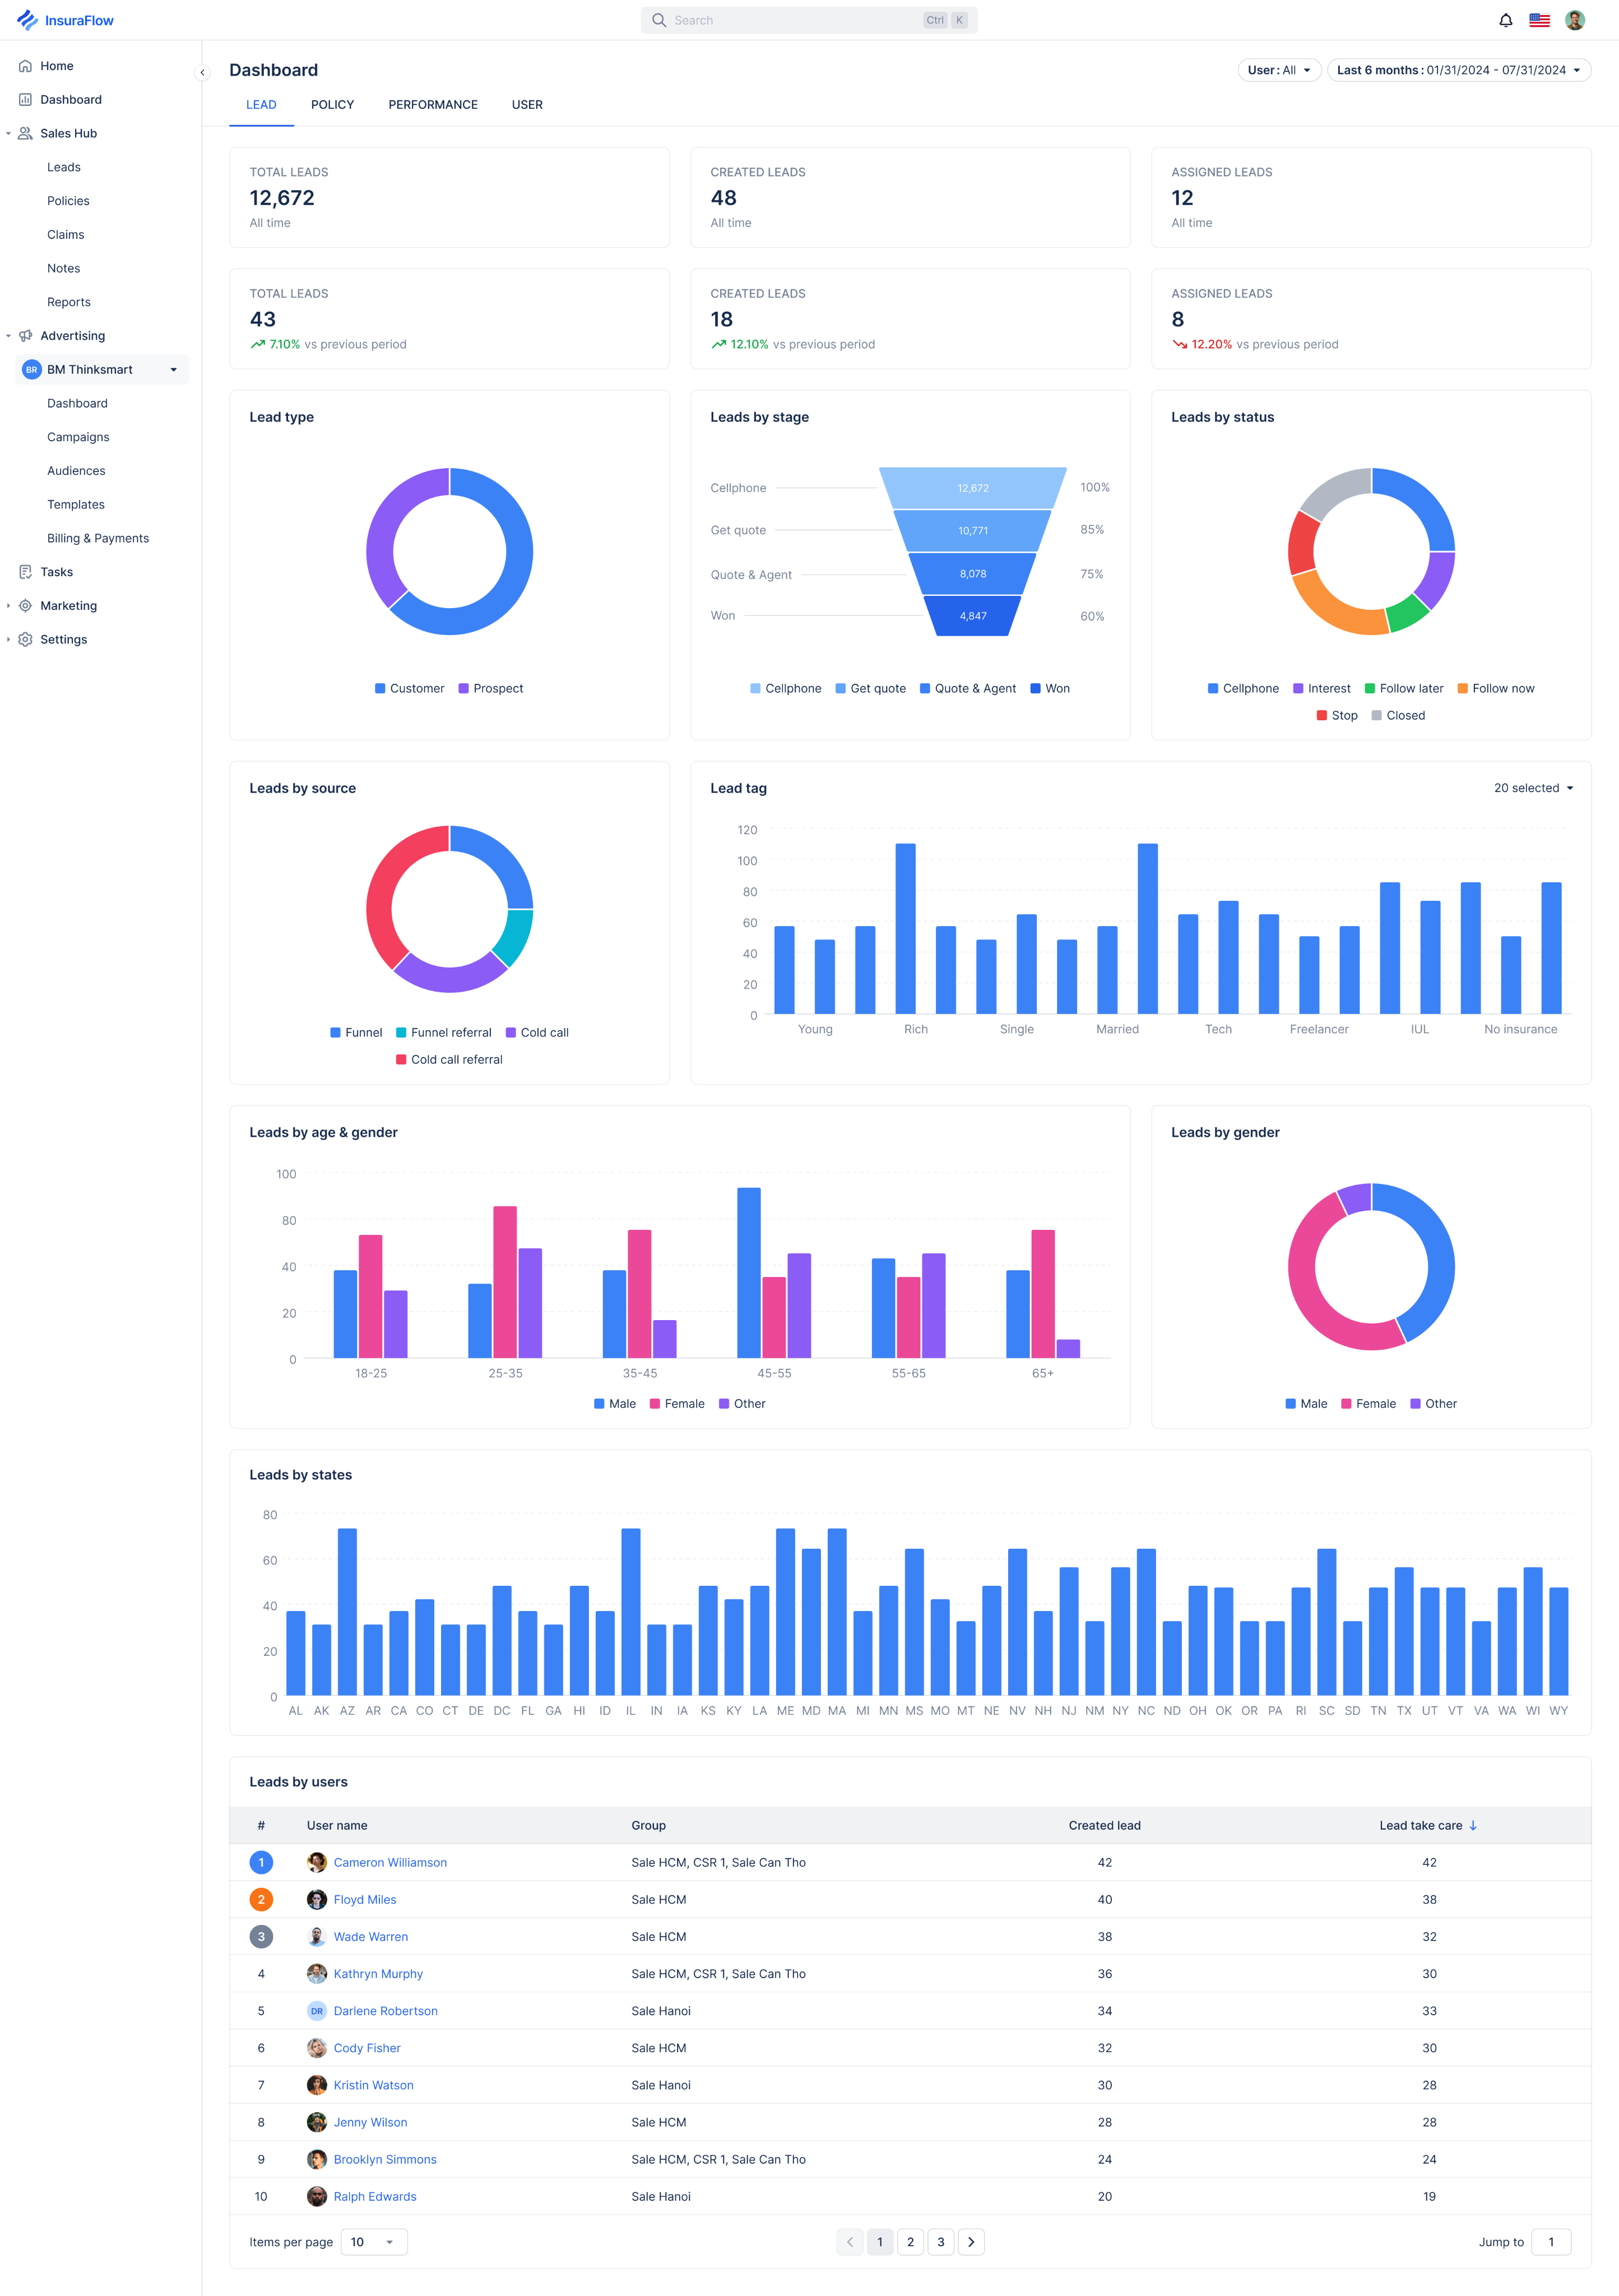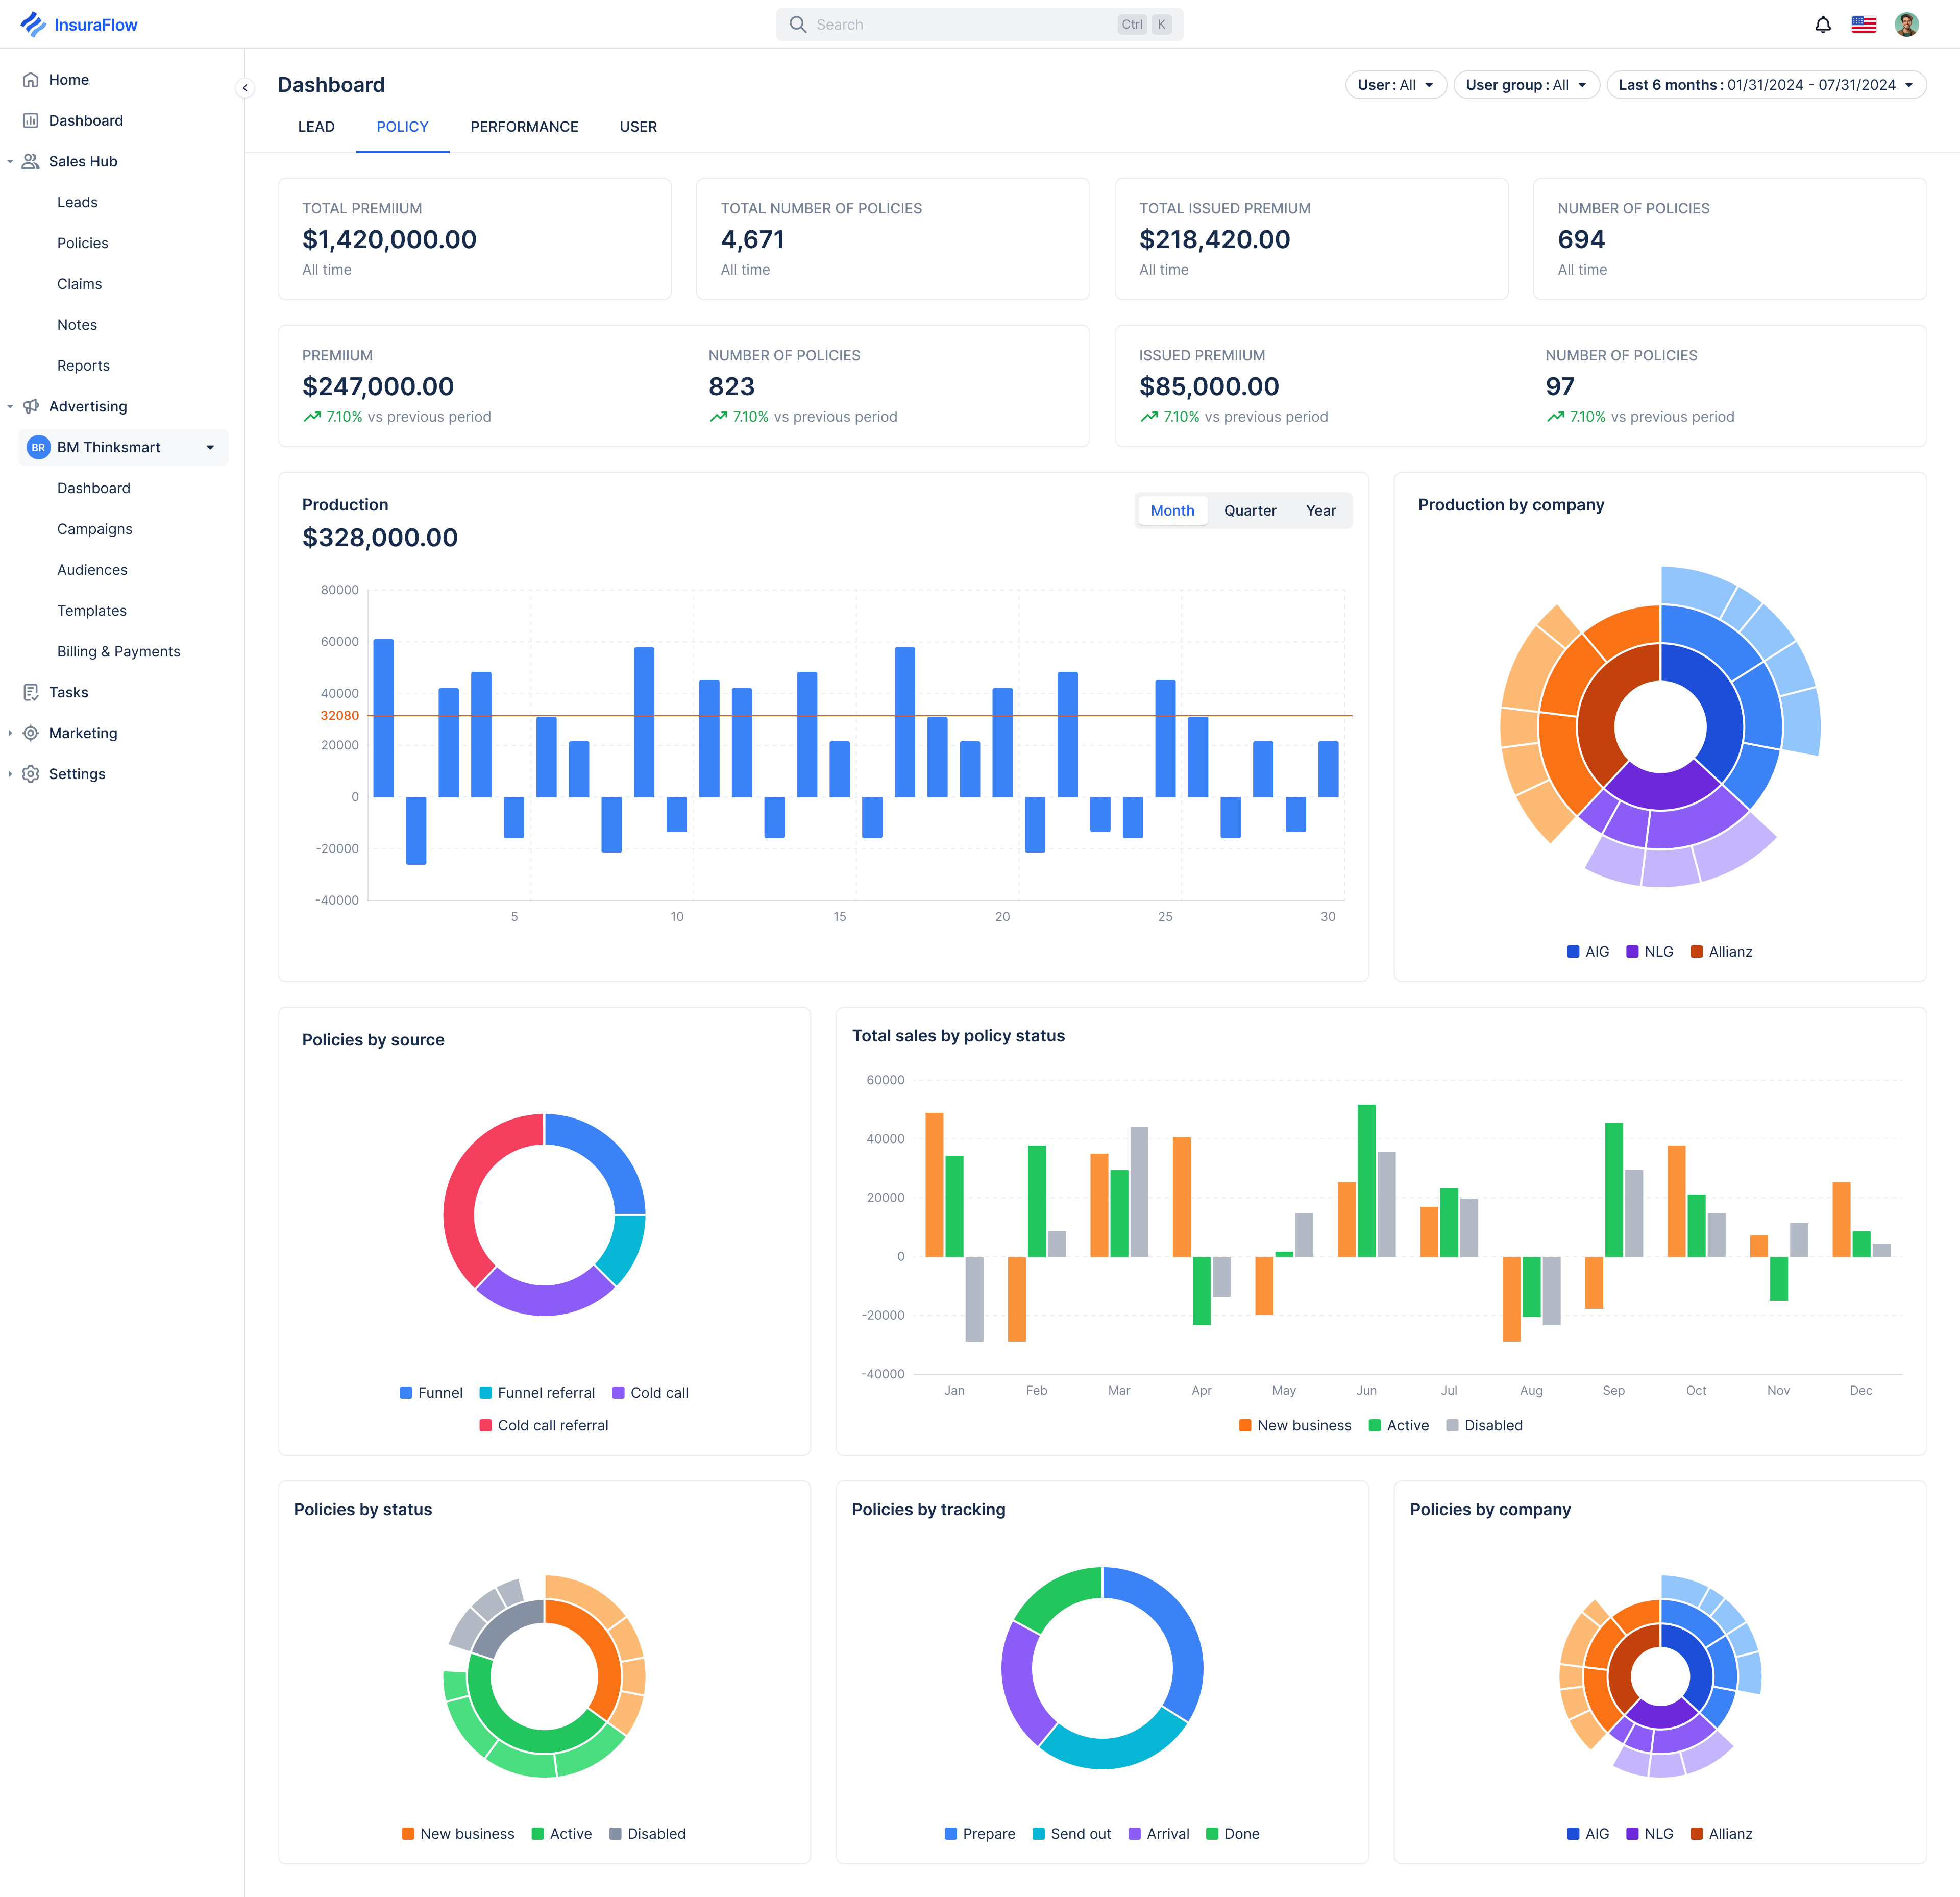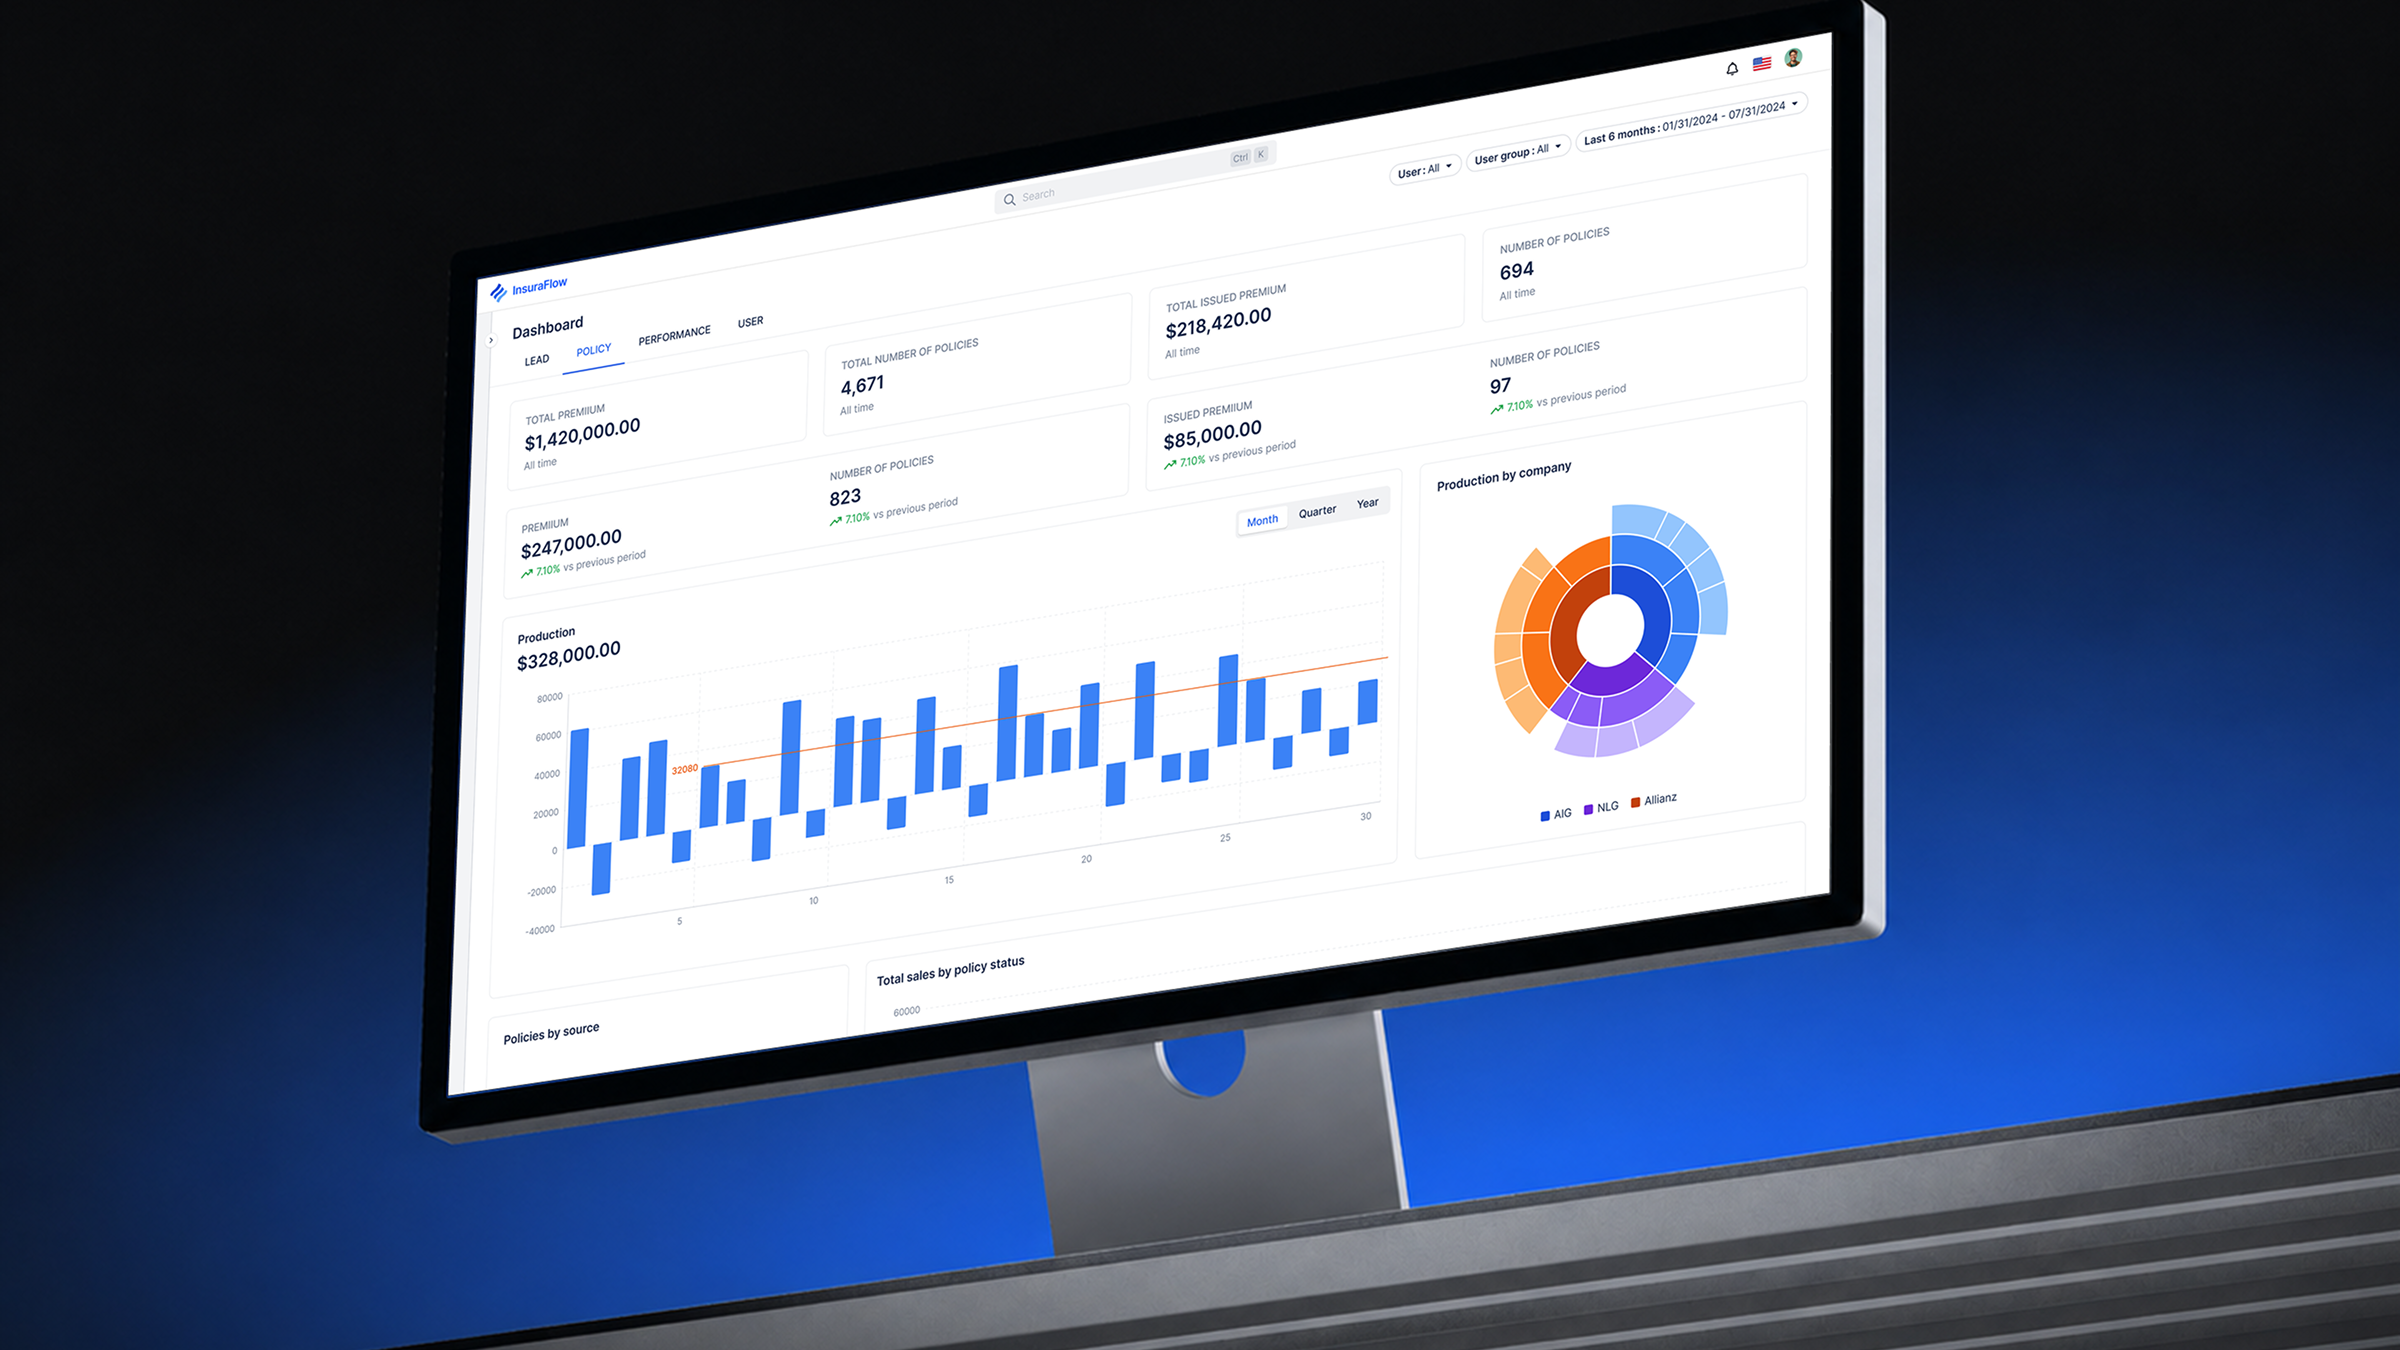
The process began with a detailed list of charts and metrics from the client.
From there, we moved to the whiteboard to group related metrics, sketch early chart ideas, and explore layout directions.
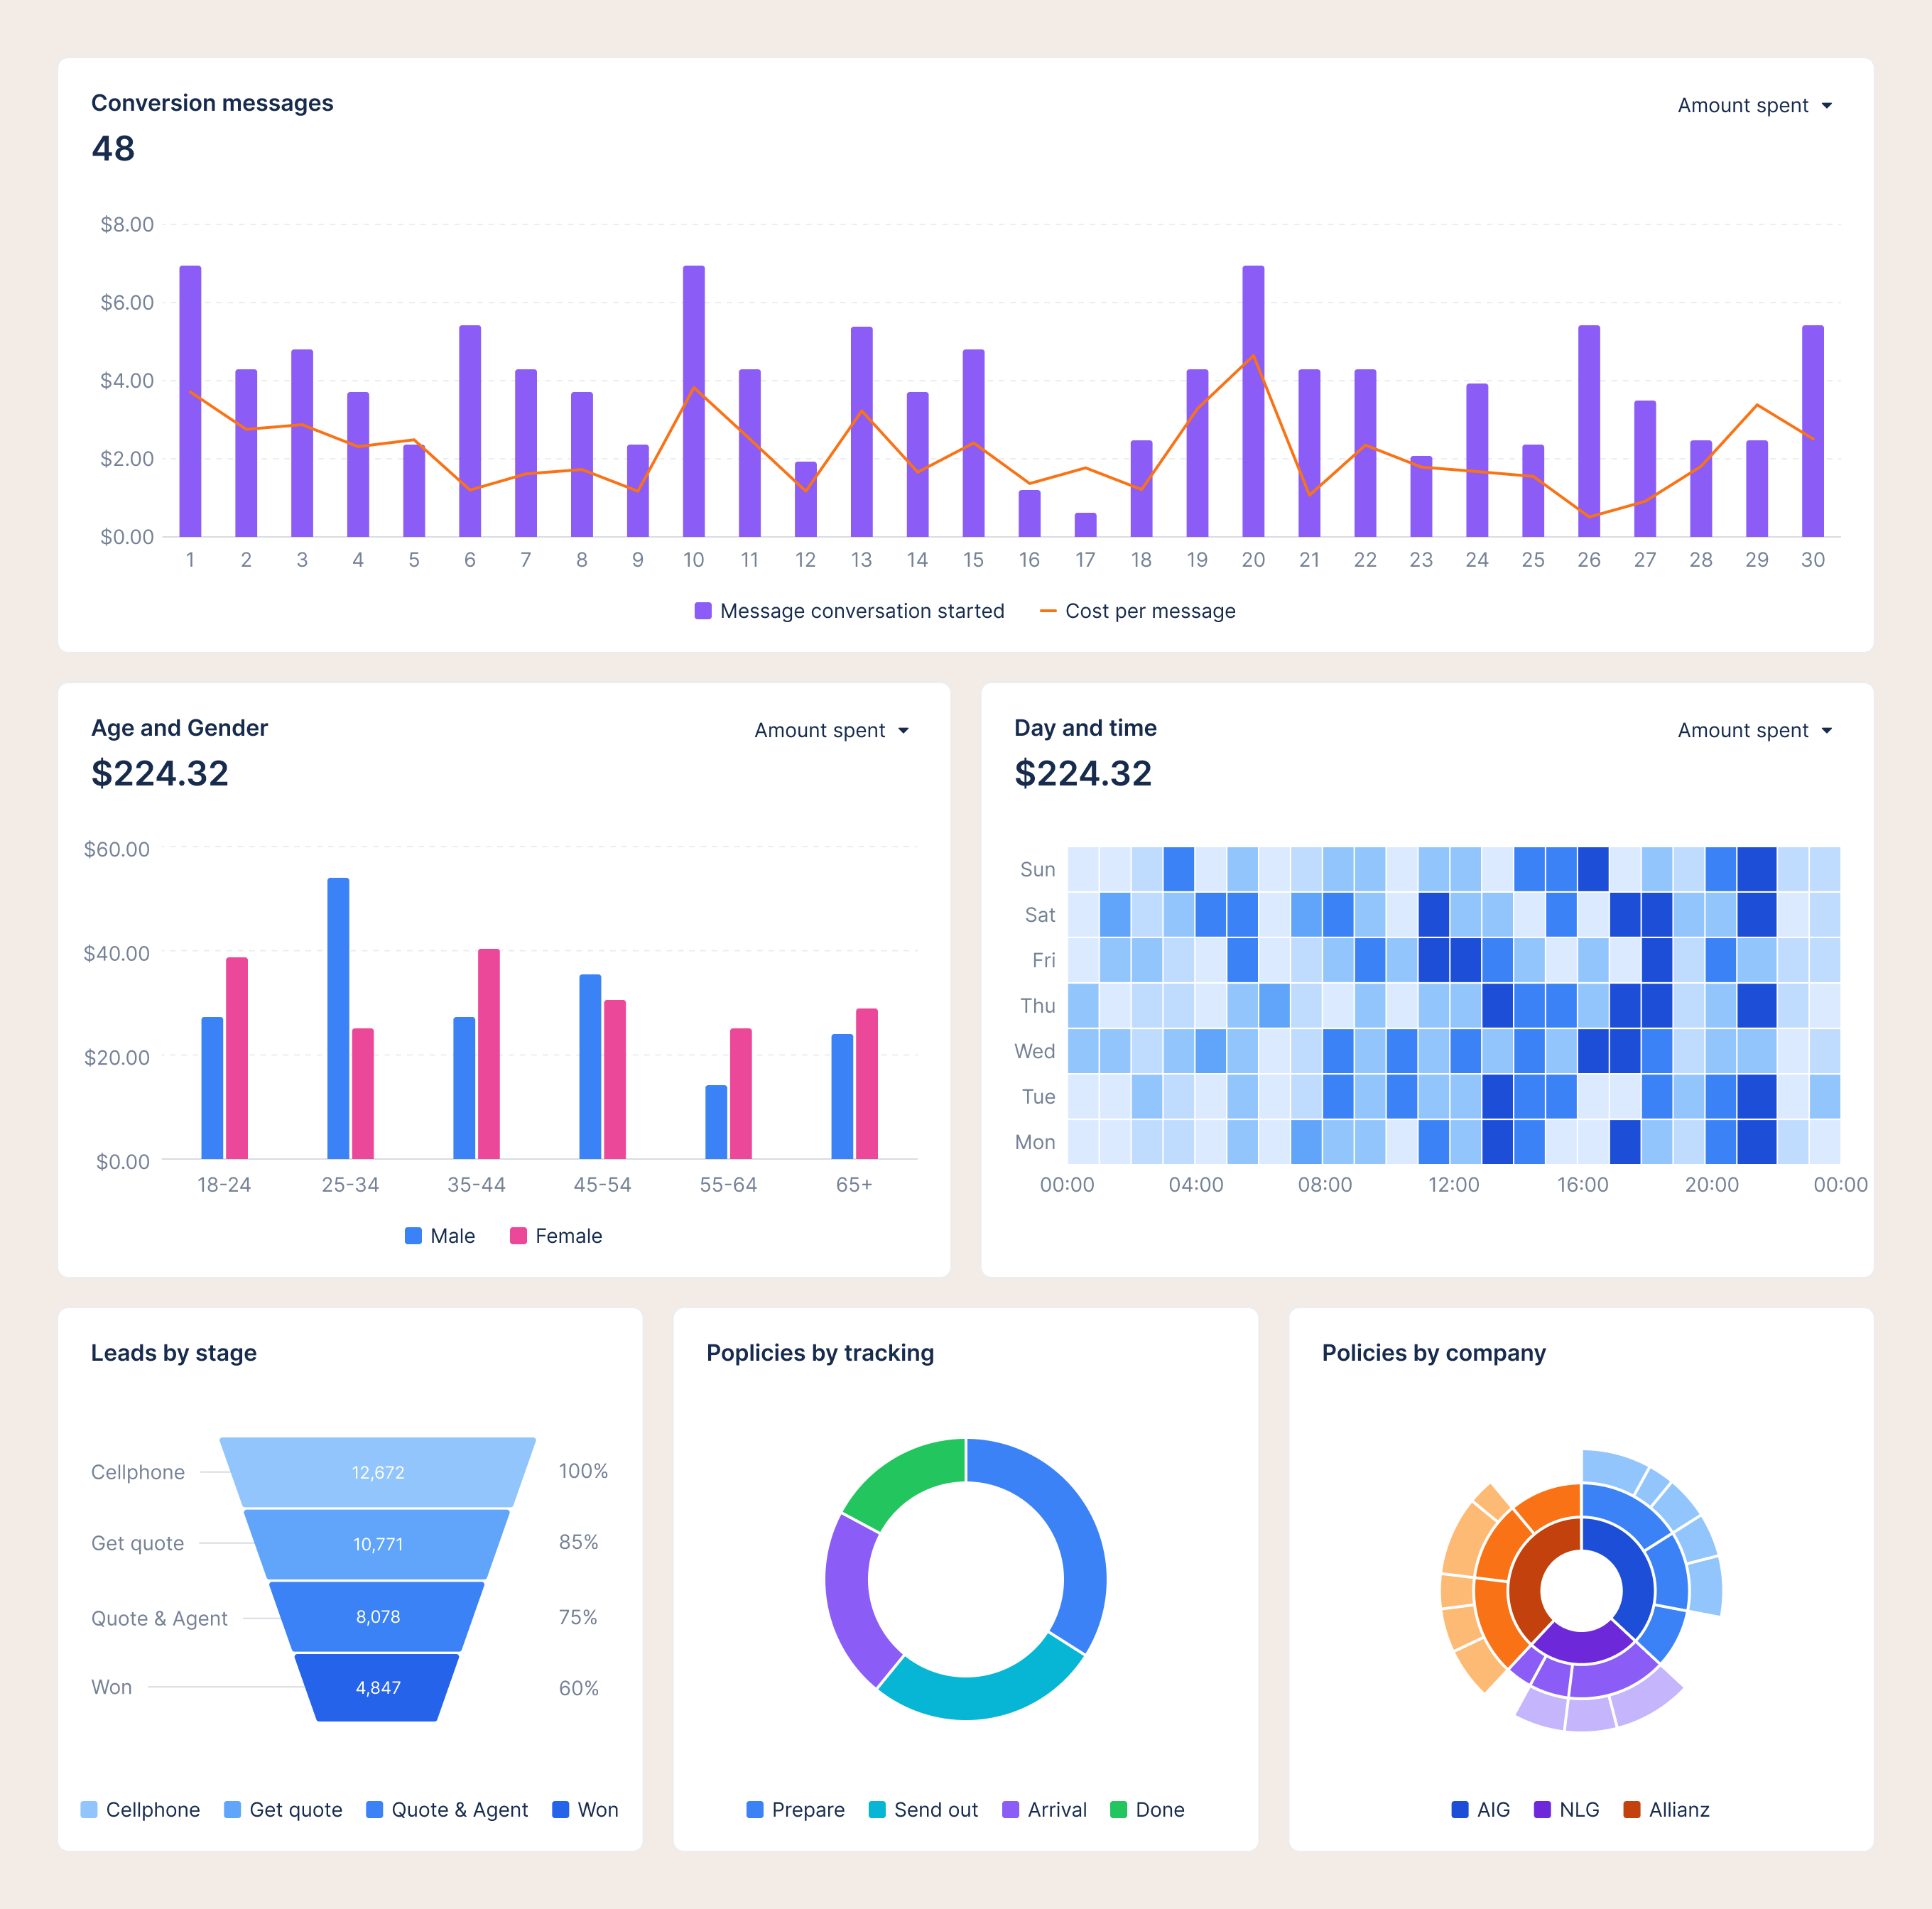
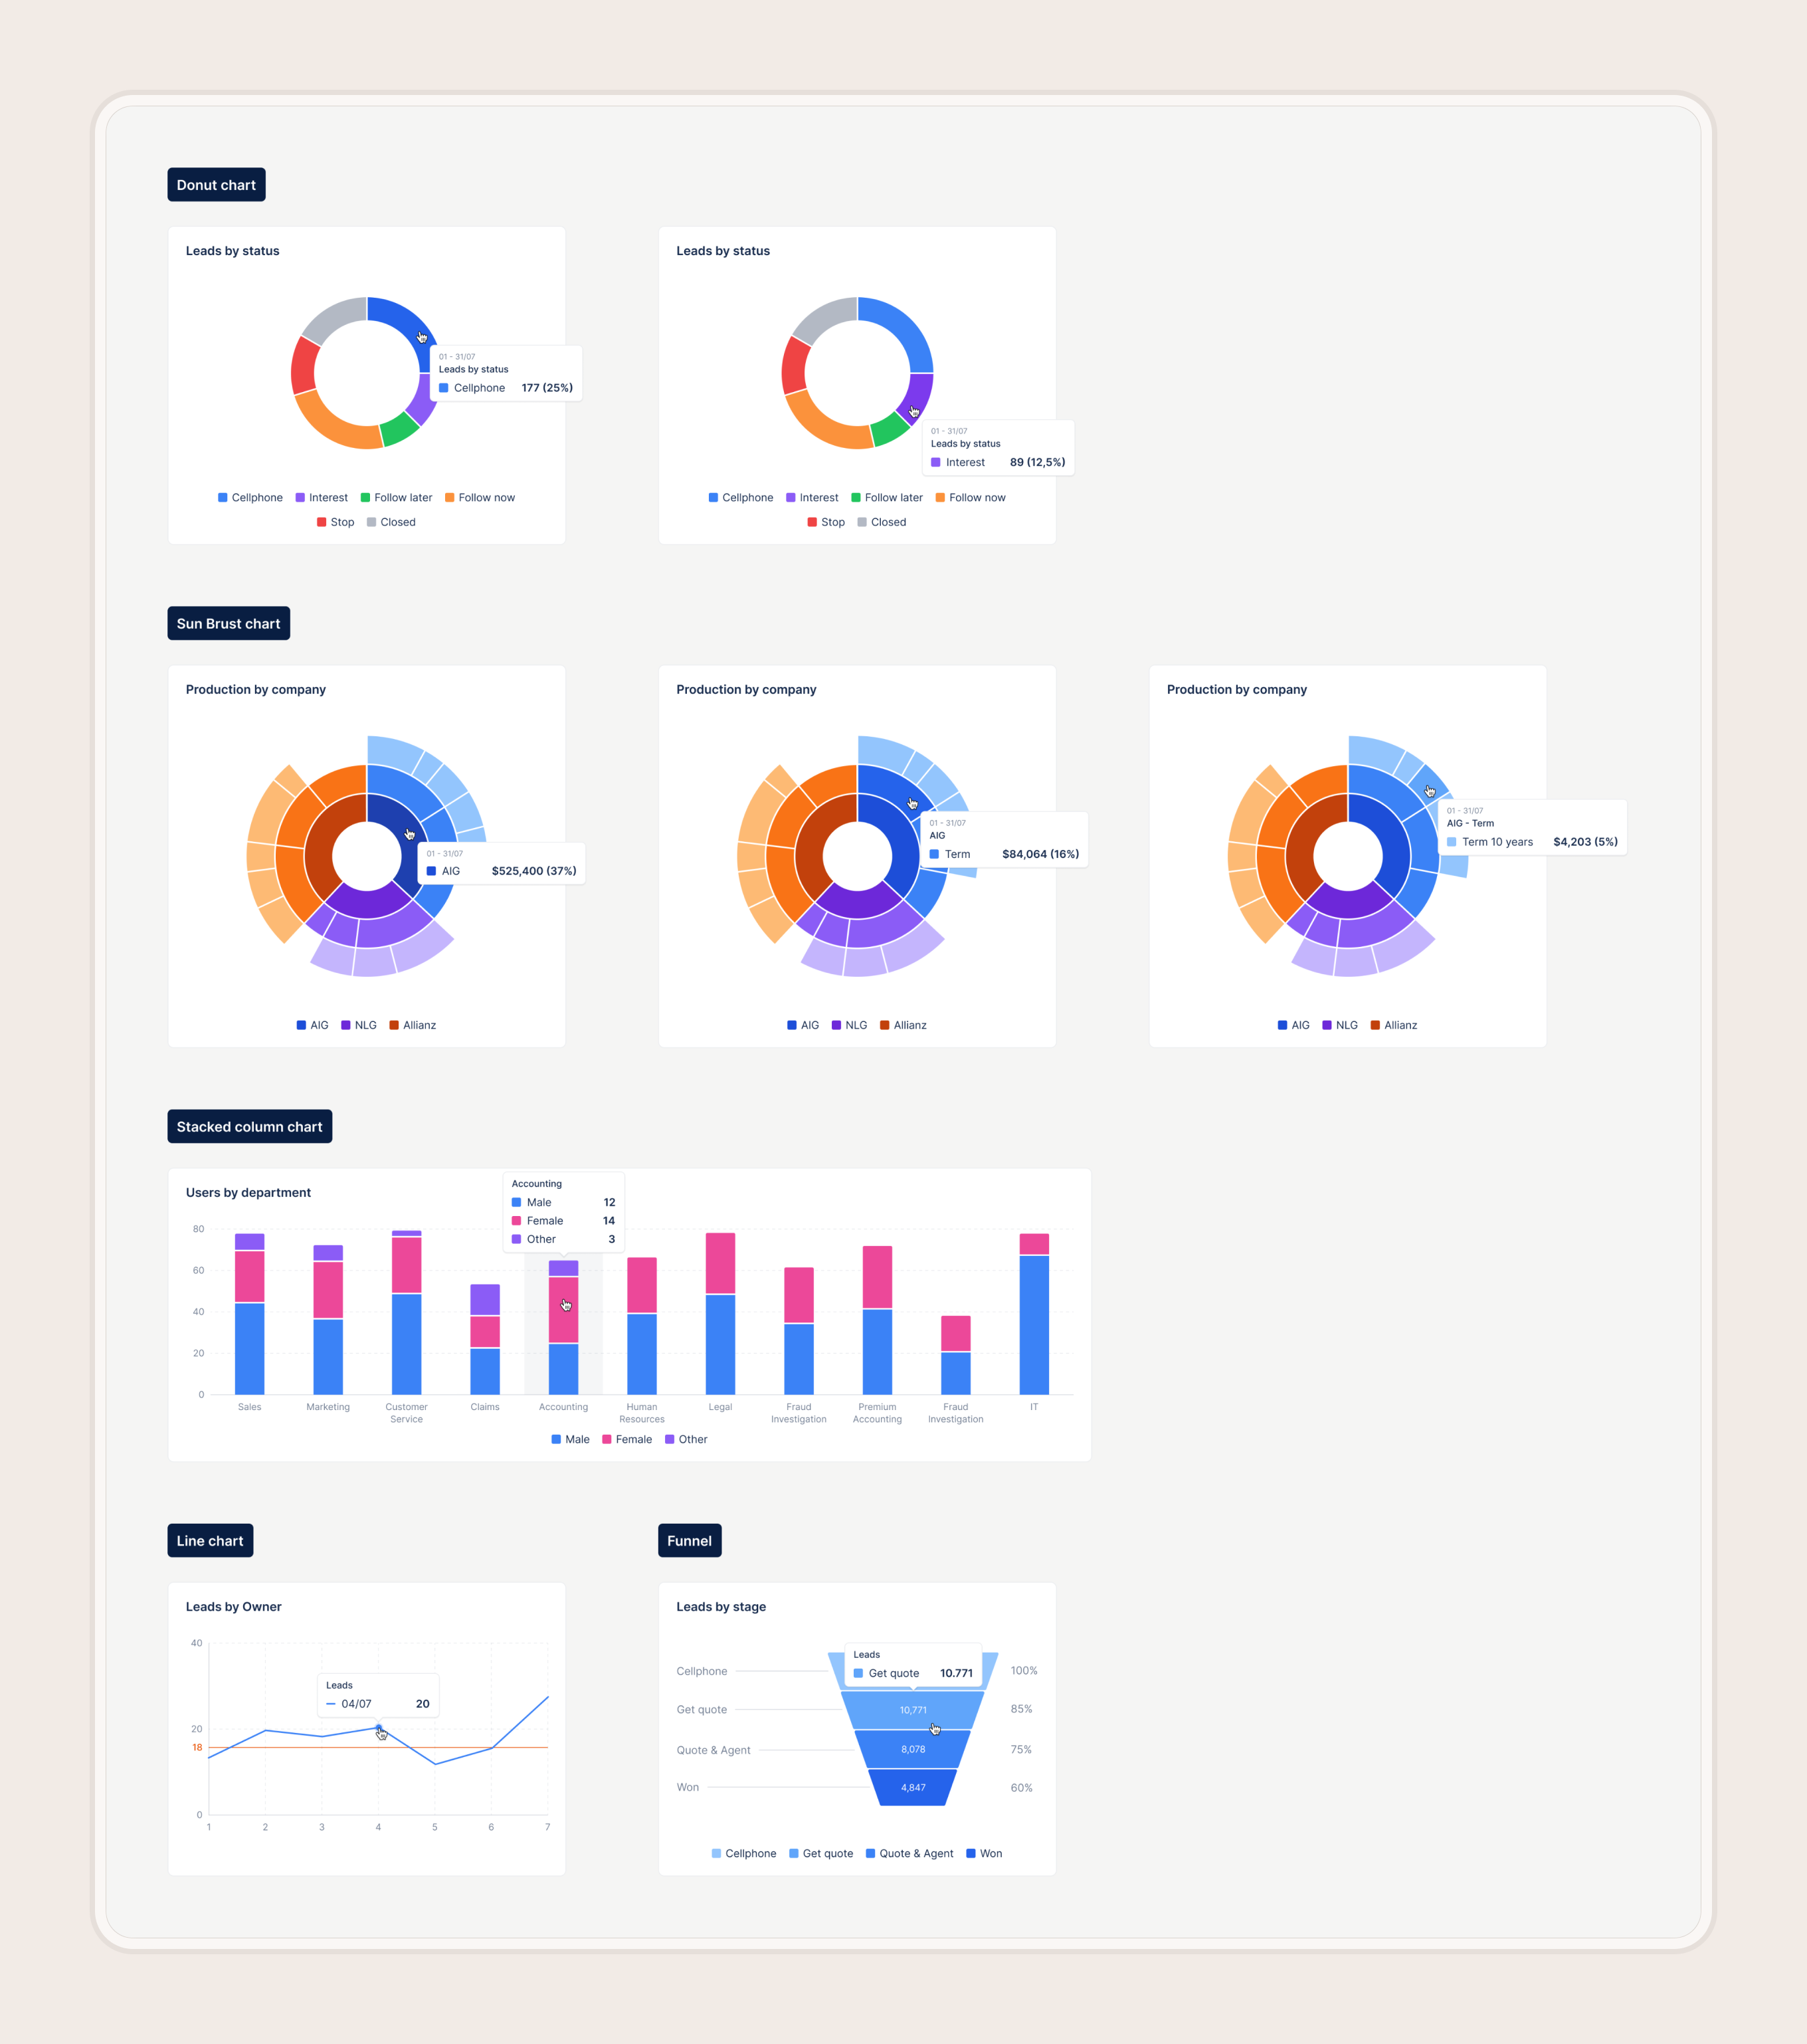
→ These discussions helped shape a clear dashboard structure, turning raw requirements into a layout that balances high-level insights with deeper analysis—without overwhelming the user.